How the demographics of general practice are changing

27 April 2016
The Health and Social Care Information Centre has published GP workforce statistics that show some dramatic changes in general practice over the past year.
Although changes to methodology meant the new figures cannot be directly compared with previous years’ publications, HSCIC has recalculated 2014 figures using the same methodology to provide accurate year-on-year comparisons. Here are the headlines:
A 2% drop in the number of GPs
- Including locums, there are 41,877 headcount GPs working in general practices with an FTE of 34,592
- Excluding locums, there are 40,697 headcount GPs, a decrease of 408 (1.0%) since 2014.
- This represents 34,055 FTE GPs, an estimated decrease of 657 (1.9%)
- Excluding trainees, retainers and locums, there are 35,586 headcount GPs, a decrease of 233 (0.7%) since 2014
- This represents 29,271 FTE GPs, an estimated decrease of 980 (3.2%)
An increase in GPs per patient
- There were 65.5 practitioners per 100,000 population in 2015, compared with 64.9 in 2005
- Central Midlands has the lowest number of GPs, excluding trainees, locums and retainers per 100,000 population (59.2). The South-West has the highest number of GPs per 100,000 population (75.4)
An increase in practice nurses
- There are 15,398 FTE nurses, an increase of 336 (2.2%) since 2014, but there are 9,149 FTE other direct patient care staff, a decrease of 129 (1.4%)
- There are 63,728 FTE admin/non-clinical staff, a decrease of 328 (0.5%)
200 fewer GP practices due to closures and mergers
- There were 7,674 GP practices in England, a decrease of 201 (2.6%) on last year
- The number of patients per practice has grown steadily in the last decade rising from 6,250 to 7,450 between 2005 and 2015, reflecting the move towards larger practices
- Average practice list size varies between 6,284 in Lancashire and Greater Manchester and 9,124 in Wessex
- Total registered patients in England increased from 56.5 million in 2014 to 57.2 million (1.2%)
- Based on the data submitted from 88.1% of practices, there are 9.9% of practices that are single-handed
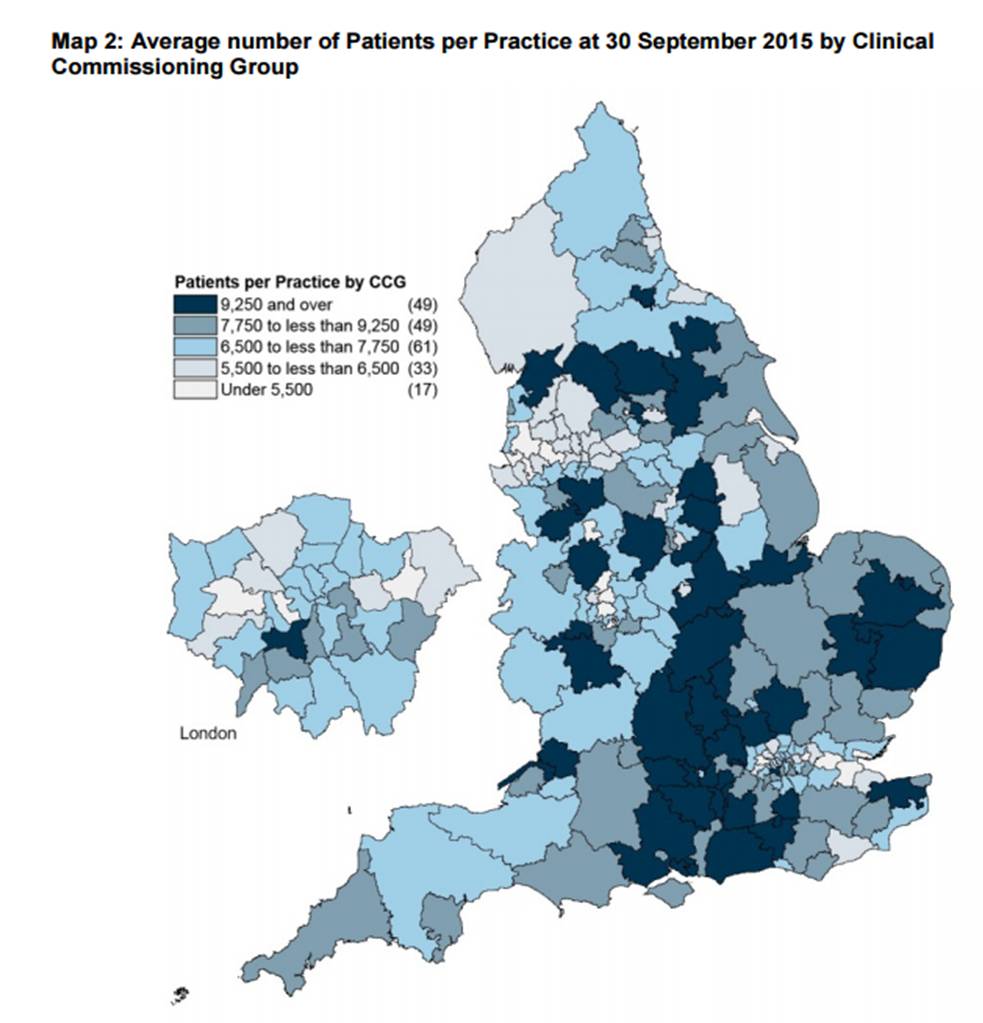
patients per practice
The number of practices on PMS contracts is dropping
- There are 4,802 practices (62.6%) holding General Medical Service (GMS) contracts; there are also a small number of GMS contracts (6) held by limited companies
- There are 2,584 (33.7%) Personal Medical Service (PMS) contracts in 2015, down from 3,143 in 2014, with some PMS contracts (13) also being held by limited companies
- The 2015 data show there are 269 practices that have Alternative Personal Medical Service (APMS) contracts, a decrease from 290 in 2014, of which approximately a third (92) are now administered privately
- The number of dispensing practices has fallen by 130 over the past 10 years; however as a proportion of the total they have remained roughly the same, 13.8% (1,163) in 2005 to 13.5% (1,033) in 2015
The profession is now more female and slightly younger
- 54.4% of GPs (excluding locums) are female. Since 2005 the female practitioner headcount has increased from 42.5% of the total GP (excluding locums) population to 54.4% in 2015
- England has 20.8% practitioners aged 55 and over, a slight decrease from 21.3% in 2005. The proportion under 35 rose from 12.2% to 13.4% over the same period
- London has the highest proportion of practitioners aged 55 and over (24.8%) followed by the East of England (22.5%) and then West Midlands (22.3%). The North Midlands has the lowest proportion aged 55 and over at 17.9%
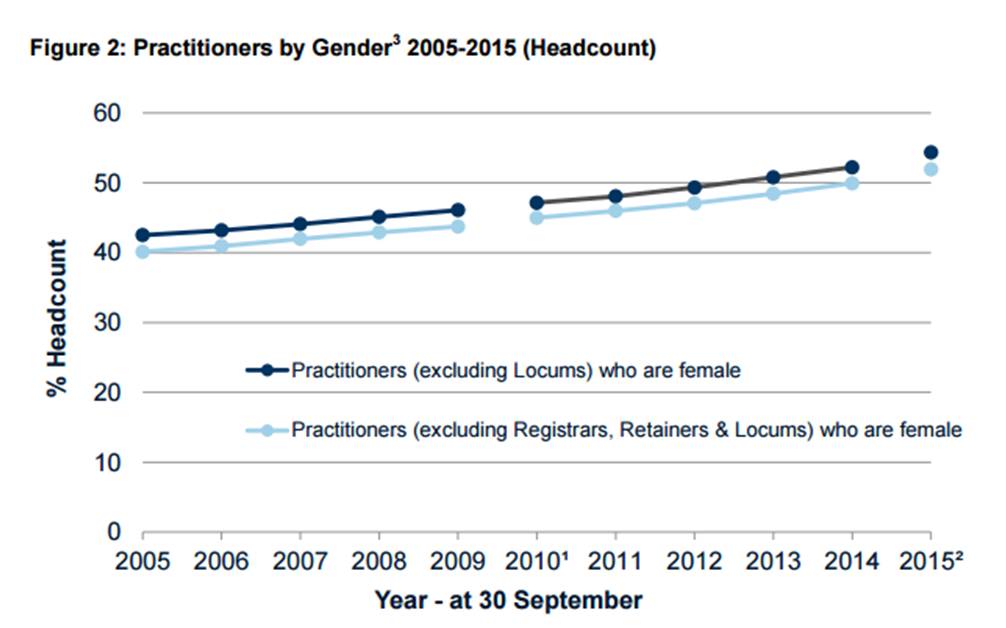
gender


