ECG quiz: Can you work out the heart rate from a printout?
As part of a series on Pulse, Dr Yassir Javaid, a GPwSI in cardiology and echocardiography, asks what these ECGs could signify. See bottom of the page for answers
Question 1
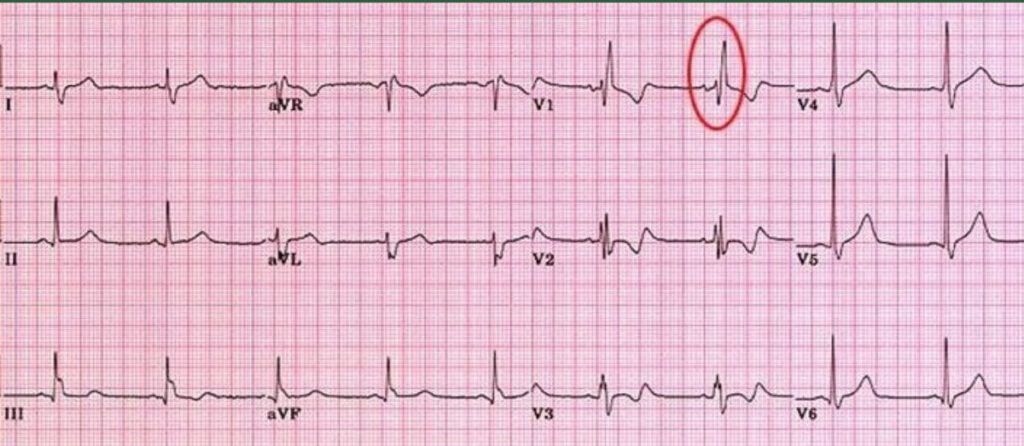
An ECG was done on an asymptomatic 34 year old patient as part of an insurance medical
A Anterior myocardial infarct
B Right bundle branch block
C Left bundle branch block
D Inferior myocardial infarct
E Wolff-Parkinson-White syndrome
Question 2
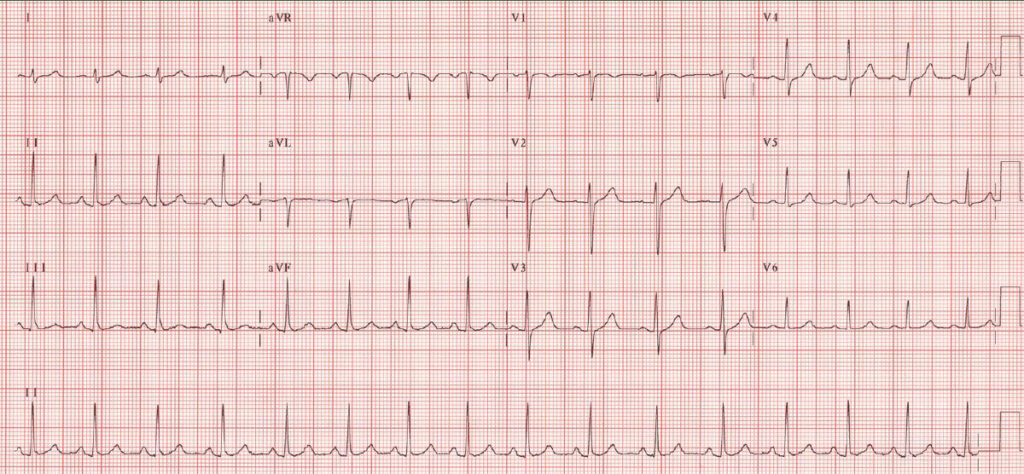
What is the heart rate on this ECG?
A 30 bpm
B 60 bpm
C 75 bpm
D 100 bpm
E 150 bpm
Question 3
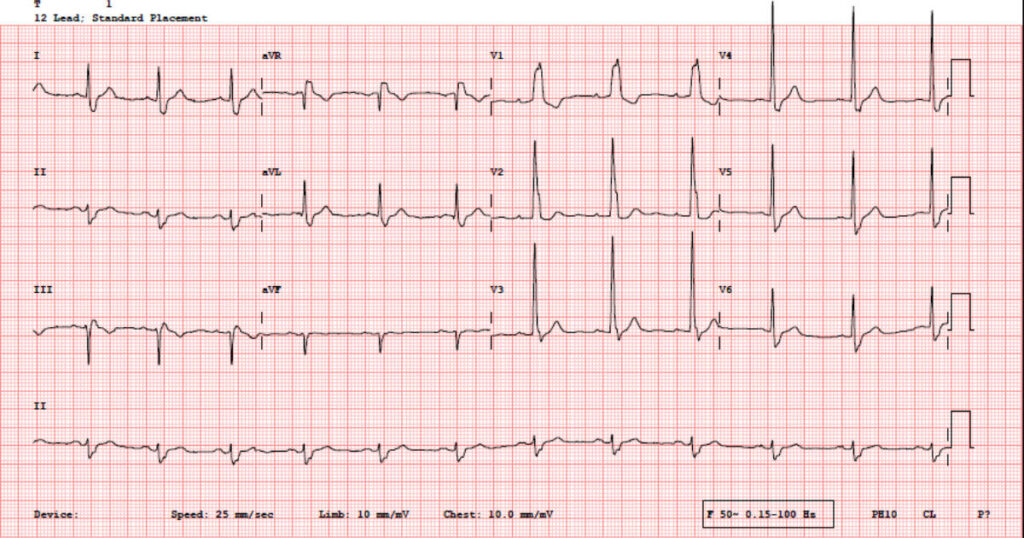
Describe the axis on this ECG
A Normal
B Left axis deviation
C Right axis deviation
D Extreme right axis deviation
Answers
Question 1 Right bundle branch block
Explanation
There is clearly a broad QRS complex which is predominantly positive in V1 indicative of RBBB. You can also see an RSR pattern to the QRS complex in V1 reflective of the fact that the left ventricle is depolarising before the right ventricle.
LBBB is almost always pathological but RBBB in an asymptomatic fit patient may well not be associated with significant underlying cardiac pathology. It would be reasonable to do an echo
Question 2 100 bpm
Explanation
There are three ways to work out the heart rate from an ECG:
1. Read the ECG print out. The ECG interpretive software is usually very accurate at working out the heart rate
2. If the rhythm is regular, you can calculate 300 divide by the number of large squares between QRS complexes
3. In standard ECG settings you can assume the rhythm strip is 10 seconds long. Therefore you can multiply the number of QRS complexes on the rhythm strip by 6 to get the heart rate per minute. This method has the advantage of being accurate even in irregular rhythms.
Question 3 Left axis deviation
Explanation
There are three ways to work out the axis from an ECG:
1. Read the ECG print out. The ECG interpretive software is usually very accurate at working out the QRS axis – if it’s less than -30 degrees it’s left axis deviation and if it’s more than +90 degrees it’s right axis deviation. Between -30 and + 90 is normal
2. Using leads I and II – if QRS in both leads are positive the axis is normal. If QRS is positive in I and negative in II then it’s left axis deviation. If QRS is negative in I and positive in II then it’s right axis deviation.
3. Exactly as above but using lead aVF instead of lead II
Visit Pulse Reference for details on 140 symptoms, including easily searchable symptoms and categories, offering you a free platform to check symptoms and receive potential diagnoses during consultations.
Related Articles


Most


IMPORTANT LINKS
MORE FROM COGORA
© Cogora 2026
Cogora Limited. 1 Giltspur Street, London EC1A
9DD Registered in the United Kingdom. Reg. No. 2147432